On Apr 16, 2014, at 7:26 AM, Aaron Halfaker
<ahalfaker(a)wikimedia.org> wrote:
The SVGs plots I made don't show up well in gmail, so here's some PNGs
On Wed, Apr 16, 2014 at 9:24 AM, Aaron Halfaker
<ahalfaker(a)wikimedia.org> wrote:
Hi Gilles,
I think I know just the thing you're looking for.
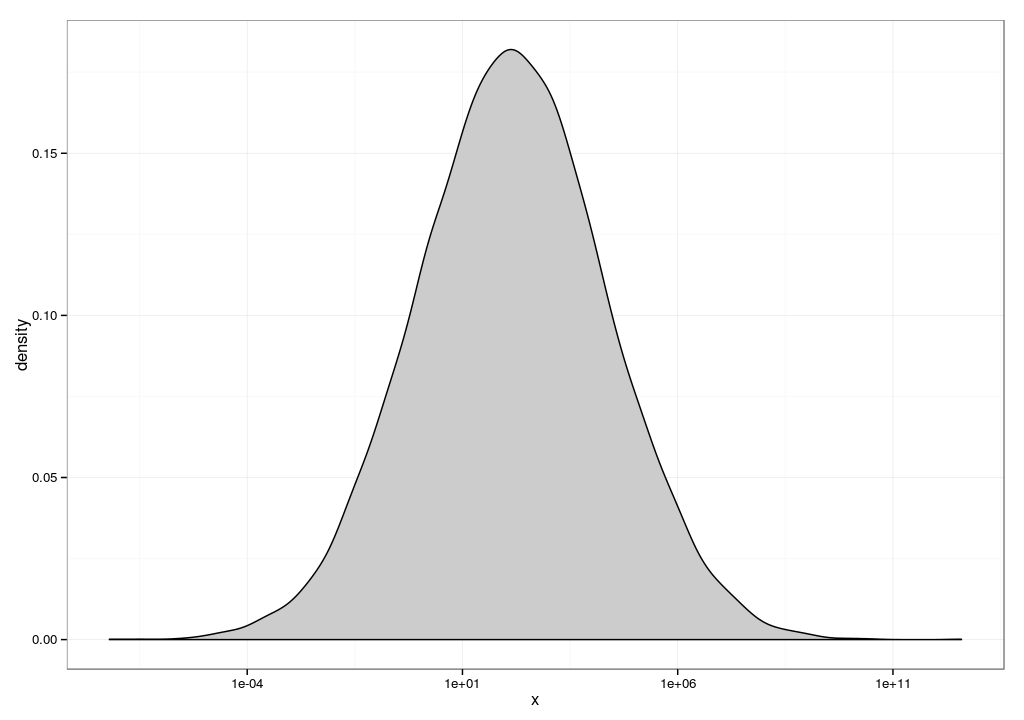
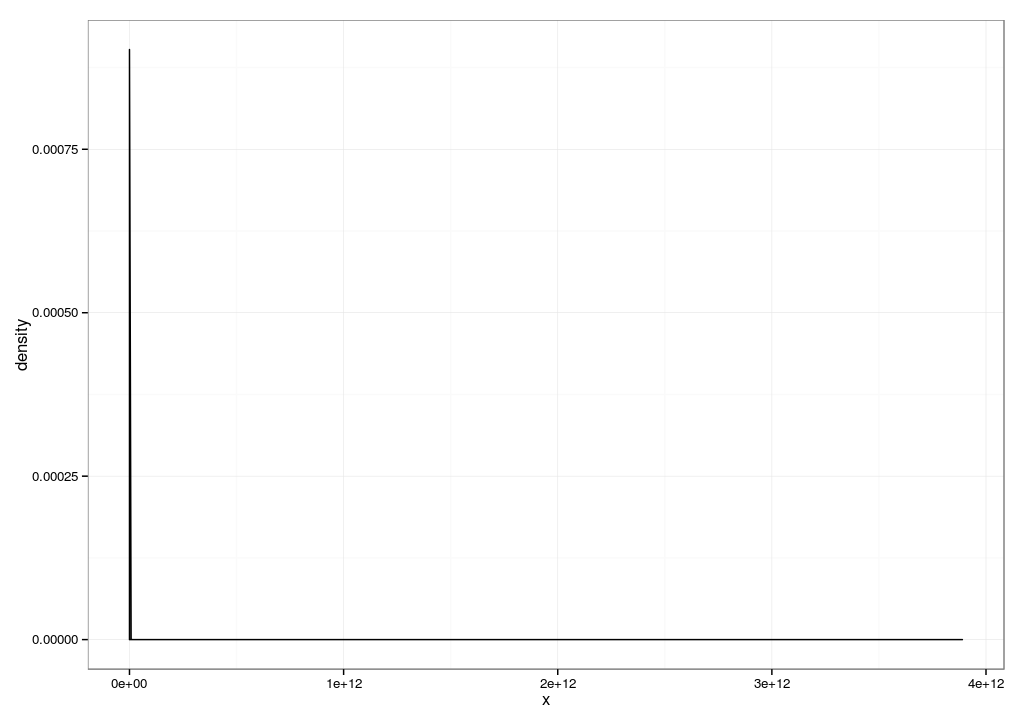
It turns out that much of this performance data is log-normally distributed[1].
Log-normal distributions tend to have a hockey stick shape where most of the values are
close to zero, but occasionally very large values appear[3]. Taking the mean of a
log-normal distributions tend to be sensitive to outliers like the ones you describe.
A solution to this problem is to generate a geometric mean[2] instead. One convenient
thing about log-normal data is that if you log() it, it becomes normal[4] -- and not
sensitive to outliers in the usual way. Also convenient, geometric means are super easy
to generate. All you need to do is this: (1) pass all of the data through log() (2) pass
the same data through mean() (or avg() -- whatever) (3) pass the result through exp().
The best thing about this is that you can do it in MySQL.
For example:
SELECT
country,
mean(timings) AS regular_mean,
exp(log(mean(timings)) AS geomteric_mean
FROM log.WhateverSchemaYouveGot
GROUP BY country
1.
https://en.wikipedia.org/wiki/Log-normal_distribution
2.
https://en.wikipedia.org/wiki/Geometric_mean
3. See distribution.log_normal.svg (24K)
4. See distribution.log_normal.logged.svg (33K)
-Aaron
On Wed, Apr 16, 2014 at 8:42 AM, Dan Andreescu <dandreescu(a)wikimedia.org> wrote:
>>> So, my latest idea for a solution is to write a python script that will
import the section (last X days) of data from the EventLogging tables that we're
interested in into a temporary sqlite database, then proceed with removing the upper and
lower percentiles of the data, according to any column grouping that might be necessary.
And finally, once the data preprocessing is done in sqlite, run similar queries as before
to export the mean, standard deviation, etc. for given metrics to tsvs. I think using
sqlite is cleaner than doing the preprocessing on db1047 anyway.
>>>
>>> It's quite an undertaking, it basically means rewriting all our current
SQL => TSV conversion. The ability to use more steps in the conversion means that
we'd be able to have simpler, more readable SQL queries. It would also be a good
opportunity to clean up the giant performance query with a bazillion JOINS:
https://gitorious.org/analytics/multimedia/source/a949b1c8723c4c41700cedf6e…
which can actually be divided into several data sources all used in the same graph.
>>>
>>> Does that sound like a good idea, or is there a simpler solution out there
that someone can think of?
>
> Well, I think this sounds like we need to seriously evaluate how people are using
EventLogging data and provide this sort of analysis as a feature. We'd have to hear
from more people but I bet it's the right thing to do long term.
>
> Meanwhile, "simple" is highly subjective here. If it was me, I'd clean
up the indentation of that giant SQL query you have, then maybe figure out some ways to
make it faster, then be happy as a clam. So if sql-lite is the tool you feel happy as a
clam with, then that sounds like a great solution. Alternatives would be python, php,
etc. I forgot if pandas was allowed where you're working but that's a great
python library that would make what you're talking about fairly easy.
>
> Another thing for us to seriously consider is PostgreSQL. This has proper f-ing
temporary tables and supports actual people doing actual work with databases. We could
dump data, especially really simple schemas like EventLogging, into PostgreSQL for
analysis.
>
> _______________________________________________
> Analytics mailing list
> Analytics(a)lists.wikimedia.org
>
https://lists.wikimedia.org/mailman/listinfo/analytics
<distribution.log_normal.logged.png>
<distribution.log_normal.png>
_______________________________________________
Analytics mailing list
Analytics(a)lists.wikimedia.org