Hi all,
Here is the usual look at our most important readership metrics. This time we see a seasonal decline in desktop engagement and rise in mobile engagement over the winter holidays.
As laid out earlier, the main purpose is to raise awareness about how these are developing, call out the impact of any unusual events, and facilitate thinking about core metrics in general. As always; feedback and discussion welcome. Week-over-week and month-over-month changes are now being recorded on the Product page at MediaWiki.org. This edition of the report covers a timespan of four weeks.
The chart below looks at long-term traffic trends from May 2013 - December 2016. This shows that over the last three and a half years, the annual change in overall pageviews is down 3%, desktop is down 16%, and mobile (web + apps) is trending upwards at a rate of 23%. However, the past few months have seen total pageviews increasing year-over-year (chart further below).

Now to the usual data. (All numbers below are averages for December 5, 2016 - January 1, 2017 unless otherwise noted.)
Pageviews
Total: 528 million/day (-0.2% from the previous report)
Context (April 2015-January 2017):

See also the Vital Signs dashboard
Similar to last year, overall daily pageviews declined for the 3 weeks leading up to Christmas. However, mobile pageviews spike around Christmas and New Years.
To facilitate our understanding of which traffic movements are seasonal and which may indicate lasting changes, here is a chart overlaying the total pageview numbers back to May 2013 (the earliest time for which we have data according to the current pageview definition):

The blue lines shows a seasonal dip in pageviews around Christmas time. Since then, total pageviews have been rising, as expected. The year-over-year increase in total pageviews has continued (December 2016 is up 5.9% from December 2015).
Desktop: 51.5% (previous report: 54.1%)
Mobile web: 46.8% (previous report: 44.8%)
Apps: 1.7% (previous report: 1.1%)

Since the last report timeframe, overall mobile percentage rose, mainly due to the large spike around Christmas (58% mobile pageviews) and New Years (59% mobile pageviews). This resembles the Christmas bump from 2015, however at a level that is about 3-4% higher now. While December 20, 2015 was the first ever day where the majority of pageviews were mobile, the week from December 26, 2016 to January 1, 2017 marks the first full week where this was the case (53.6% mobile wep + app)! Presumably though this will drop again below parity in January. Also, a caveat that part of this increase was caused by the iOS Wikipedia app’s pageviews almost quadrupling from December 20 on, which might be an anomaly. However, this does not have a large effect overall, as it increases mobile % by only about 1.3%.
Global North ratio: 76.8% of total pageviews (previous report: 75.3%)
Context (January 2016-January 2017):

There is a noticeable decrease in Global North pageviews percentage for a couple days around December 21, but a growth to almost 80% immediately follows.
NB: We are currently rethinking this metric and might replace it with a different country selection constructed as part of the work on the New Readers project.
Unique devices
See the announcement blog post from March 2016 for background and details on this metric. These estimated numbers are provided for all Wikimedia language projects (separately for the desktop and mobile web version). Because of the instrumentation method, there is no global metric for all projects and all languages, but following some recent discussions it is now planned to extend it to a cross-language global metric per project at least. For now, we track the daily numbers of the English Wikipedia in this report.
Daily unique devices estimate for English Wikipedia:
Mobile web: 33.6 million (previous report: 33.9 million)
Desktop: 21.6 million (previous report: 24.1 million)
Total: 55.2 million (previous report: 57.9 million)
Average mobile web ratio: 61.2% (previous report: 58.7%)
Context (January 2016- January 2017):

This metric hasn’t existed long enough yet to get a good sense of what yearly seasonalities may exist, but since the last report time frame daily unique desktop devices continued their decline until a small rise for a couple days following Christmas. Daily unique mobile devices also followed this pattern, but the decline leading up to Christmas was less pronounced.

Interestingly, even though the number of unique desktop devices was declining in early December, the number of daily views per desktop device was rising. The small increase in mobile pageviews mentioned in the last report has continued.
New app installations
Android: 19.1k/day (-3.9% from the previous report)
Daily installs per device, from Google Play
Context (last eight months):

At the beginning of December, the previously discussed increase in installs stopped for an unknown reason. However, there is a large spike of 28,452 installs on December 25. We continue to see above average install numbers for a few days, until December 31st. The number of uninstalls have been dropping slowly for the last few weeks in December.
iOS: 5.33 k/day (-0.2% from the previous report)
Download numbers from App Annie
Context (last two months):
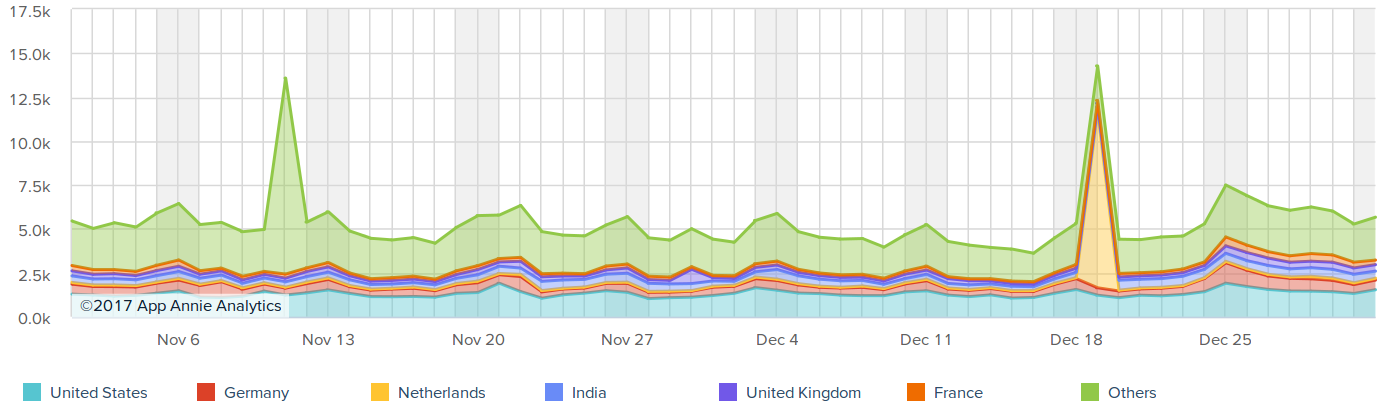
Downloads of the iOS app saw a considerable increase around December 25, remaining at higher levels for the following week - clearly the result of Apple providing a lot of christmas presents again this year. There was also a spike on December 18 in downloads from the Netherlands, which because of its form and the fact that the increase was by a suspiciously round number (from around 50 to 10,050 downloads per day) is likely to have been an anomaly.
App user retention
Android: 16.8% (previous report: 16.4%)
(Ratio of app installs opened again 7 days after installation, among all installed one week before a date that falls within this report. 1:100 sample)
Context (last seven months):

As remarked in earlier reports, this data is a bit too noisy for drawing conclusions about whether retention changed significantly between different releases. But we can at least rule out the existence of major shifts during this timespan.
iOS: N/A
Unique app users
Android: 1.179 million / day (+0.3% from the previous report)
Context (last seven months):

Android daily active users remain steady until a spike around Christmas and New Year which matches the spike in unique mobile devices and mobile pageviews.
iOS: N/A
Zareen Farooqui, Data Analyst Intern, Wikimedia Foundation
Tilman Bayer, Senior Analyst, Wikimedia Foundation
Data sources
For reference, the queries and source links used are listed below (access is needed for each). Unless otherwise noted, all content of this report is © Wikimedia Foundation and released under the CC BY-SA 3.0 license. Most of the above charts are available on Commons, too.
SELECT year, month, CONCAT(year,"-",LPAD(month,2,"0")) as yearmonth, SUM(view_count) AS allhuman, sum(IF(access_method = 'desktop', view_count, null)) AS desktophuman FROM wmf.projectview_hourly WHERE year = 2016 AND month > 10 AND agent_type = 'user' GROUP BY year, month ORDER BY year, month LIMIT 1000;
SELECT year, month, day, CONCAT(year,"-",LPAD(month,2,"0"),"-",LPAD(day,2,"0")) as date, sum(IF(access_method <> 'desktop', view_count, null)) AS mobileviews, SUM(view_count) AS allviews FROM wmf.projectview_hourly WHERE year>0 AND agent_type = 'user' GROUP BY year, month, day ORDER BY year, month, day LIMIT 1000;
SELECT access_method, SUM(view_count)/(7*4) FROM wmf.projectview_hourly WHERE agent_type = 'user' AND CONCAT(year,"-",LPAD(month,2,"0"),"-",LPAD(day,2,"0")) BETWEEN "2016-12-05" AND "2017-01-01" GROUP BY access_method;
SELECT year, month, day, CONCAT(year,"-",LPAD(month,2,"0"),"-",LPAD(day,2,"0")), SUM(view_count) AS all, SUM(IF (FIND_IN_SET(country_code, 'AD,AL,AT,AX,BA,BE,BG,CH,CY,CZ,DE,DK,EE,ES,FI,FO,FR,FX,GB,GG,GI,GL,GR,HR,HU,IE,IL,IM,I S,IT,JE,LI,LU,LV,MC,MD,ME,MK,MT,NL,NO,PL,PT,RO,RS,RU,SE,SI,SJ,SK,SM,TR,VA,AU,CA,HK,MO, NZ,JP,SG,KR,TW,US') > 0, view_count, 0)) AS Global_North_views FROM wmf.projectview_hourly WHERE year > 0 AND agent_type='user' GROUP BY year, month, day ORDER BY year, month, day LIMIT 1000;
SELECT year, month, day, CONCAT(year,"-",LPAD(month,2,"0"),"-",LPAD(day,2,"0")) as date, SUM(IF(uri_host LIKE 'en.m.wikipedia%', uniques_estimate, 0)) AS enwiki_mobile_web FROM wmf.last_access_uniques_daily WHERE year=2016 OR year=2017 GROUP BY year, month, day ORDER BY year, month, day LIMIT 1000;
SELECT year, month, day, CONCAT(year,"-",LPAD(month,2,"0"),"-",LPAD(day,2,"0")) as date, SUM(IF(uri_host LIKE 'en.wikipedia%', uniques_estimate, 0)) AS enwiki_desktop FROM wmf.last_access_uniques_daily WHERE year=2016 OR year=2017 GROUP BY year, month, day ORDER BY year, month, day LIMIT 1000;
SELECT year, month, day, CONCAT(year,"-",LPAD(month,2,"0"),"-",LPAD(day,2,"0")) AS date, SUM(IF(access_method = 'mobile web', view_count, null)) AS mobilewebviews, SUM(IF(access_method = 'desktop', view_count, null)) AS desktopviews FROM wmf.projectview_hourly WHERE year=2016 OR year=2017 AND agent_type = 'user' AND project = 'en.wikipedia' GROUP BY year, month, day ORDER BY year, month, day LIMIT 1000;
SELECT LEFT(timestamp, 8) AS date, SUM(IF(event_appInstallAgeDays = 0, 1, 0)) AS day0_active, SUM(IF(event_appInstallAgeDays = 7, 1, 0)) AS day7_active FROM log.MobileWikiAppDailyStats_12637385 WHERE userAgent LIKE '%-r-%' AND userAgent NOT LIKE '%Googlebot%' GROUP BY date ORDER BY DATE;
(with the retention rate calculated as day7_active divided by day0_active from seven days earlier, of course)
https://console.developers.google.com/storage/browser/pubsite_prod_rev_02812522755211381933/stats/installs/ (“overview”)
https://www.appannie.com/dashboard/252257/item/324715238/downloads/ (select “Total”)
https://analytics.itunes.apple.com/#/retention?app=324715238
SELECT CONCAT(year,"-",LPAD(month,2,"0"),"-",LPAD(day,2,"0")) as date, unique_count AS Android_DAU FROM wmf.mobile_apps_uniques_daily WHERE platform = 'Android';