From: Zareen Farooqui <zareenf@gmail.com>
Date: Mon, Dec 12, 2016 at 8:45 PM
Subject: Readership metrics for the timespan until December 4, 2016
To: mobile-l@lists.wikimedia.org
Cc: schang@wikimedia.org, slien@wikimedia.org, wikitech-l@lists.wikimedia.org, analytics@lists.wikimedia.org, fr-online@wikimedia.org
This resumes the usual look at our most important readership metrics. This time we can report that daily pageviews are up 4.8% (since the last report), with an interesting recent peak which meant that November’s pageviews surpassed those of November 2015 (coincidentally also) by 4.8%, after October had already seen a 2.1% year-over-year increase. The iOS Wikipedia app saw increased downloads, while the Android app’s install base has stopped its previous downward trend.
As laid out earlier, the main purpose is to raise awareness about how these metrics are developing, call out the impact of any unusual events, and facilitate thinking about core metrics in general. As always; feedback and discussion welcome. Week-over-week and month-over-month changes are now being recorded on the Product page at MediaWiki.org. This edition of the report covers a timespan of eighteen weeks.
Some other recent items of interest, in case they didn’t already catch your attention:
The WMF Reading team published its quarterly review presentation for Q1 2016-17 (July-September), which includes lots of traffic and usage data.
At the Foundation’s August metrics meeting, the Reading team gave an update on longer-term traffic trends since 2013. (TL;DR: Overall pageviews have been flat to slightly declining, mobile has been steadily rising but recently slowed down, desktop has declining during these three years. However, total pageviews have been slightly increasing year-over-year in the last few months.) See the chart below, updated with data until November:
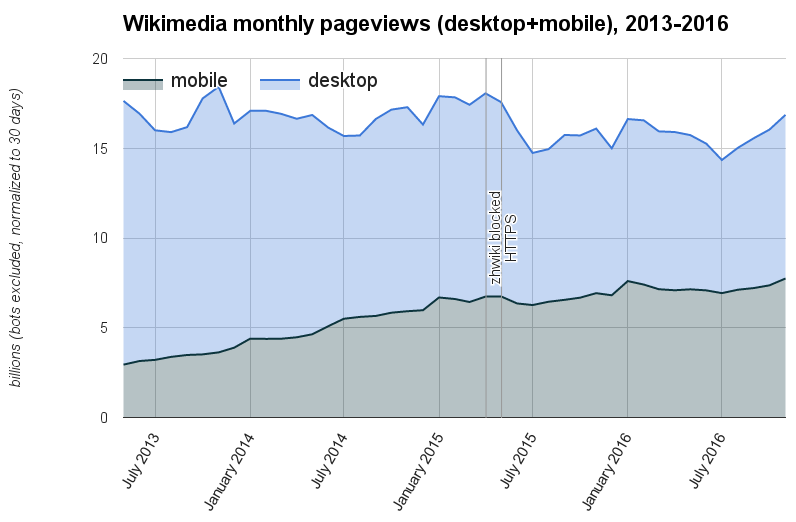
In particular, as mentioned, the number of total pageview saw year-over-year increases of +2.1% for October and +4.8% in November, in contrast to e.g. the -10.5% we had for May 2015-May 2016.
Now to the usual data. (All numbers below are averages for August 1-December 4, 2016 unless otherwise noted.)
Pageviews
Total: 529 million/day (+4.76% from the previous report timeframe, with corrected numbers for anomalously high traffic on some main pages)
Context (April 2015-December 2016):

See also the Vital Signs dashboard
(Small caveats: iOS app’s pageviews were undercounted by about 1.6 million/day from mid September to early November due to a bug.)
Overall pageviews increased steadily during the timespan of this report aside from the week ending October 30th (right before Halloween) and the end of November. There appears to be a peak in pageviews in November.
To facilitate our understanding of which traffic movements are seasonal and which may indicate lasting changes, here is a chart overlaying the total pageview numbers back to May 2013 (the earliest time for which we have data according to the current pageview definition):

Wikimedia Daily Pageviews from US

Pageviews in US do not show any drastic changes (even around the time of the US elections).
Wikimedia Daily Pageviews from Mexico

In Mexico, there seems to been a huge drop starting October 27th (perhaps some sort of local outage).
Wikimedia Daily Pageviews from Ecuador

Ecuador shows a huge spike on October 30th, followed by a drop for several days.
Desktop: 54.1% (previous report: 54.1%)
Mobile web: 44.8% (previous report: 44.6%)
Apps: 1.1% (previous report: 1.3%) (missing some iOS pageviews, cf. above)
Context (December 2015 - December 2016):

Overall mobile percentage is similar to the last report, but we did see a small increase (besides one week in August) until late September. As a reminder, mobile already has a solid majority in terms of unique devices, cf. below.
Global North ratio: 75.3% of total pageviews (previous report: 75.5%)
Context (January - December 2016):

There is a slight increase in Global North percentage in late October and November, but overall this number is relatively steady.
NB: We are currently rethinking this metric and might replace it with a different country selection constructed as part of the work on the New Readers project.
Unique devices
See the announcement blog post from March for background and details on this recently introduced metric. These estimated numbers are provided for all Wikimedia language projects (separately for the desktop and mobile web version). Because of the instrumentation method, there is no global metric for all projects and all languages, but following some recent discussions it is now planned to extend it to a cross-language global metric per project at least. For now, we track the daily numbers of the English Wikipedia in this report.
Daily unique devices estimate for English Wikipedia:
Mobile web: 33.9 million (previous report: 32.2 million)
Desktop: 24.1 million (previous report: 22.3 million)
Total: 57.9 million (previous report: 54.5 million)
Average mobile web ratio: 58.7% (previous report: 59.3%)
Context (January- December 2016):

This metric hasn’t existed long enough yet to get a good sense of what yearly seasonalities may exist, but since the last report time frame daily unique desktop devices show an increasing upward trend until early November, where there is a peak and then an apparent drop (which parallels the peak in pageviews).

To understand the peak in daily unique devices, we plotted the ratio of daily pageviews to daily unique devices. There is a small bump in the mobile ratio in early November, but it is too small to fully explain the rise in pageviews around this time.
New app installations
Android: 19.9k/day (+1.21% from the previous report)
Daily installs per device, from Google Play
Context (last seven months):

Download numbers increased in September and have sustained previous levels so far, possibly helped by the app’s inclusion on the Education category page in Google’s Play Store. There was an additional bump in mid September (reason unknown). The number of daily uninstalls decreased slightly. During the timespan of the previous report, installs had markedly decreased (except for a so far unexplained bump during two weeks in July), which combined with the high uninstall numbers had caused the app’s install base to shrink from 15.5 million on March 31 to 15.1 million at the beginning of August. This trend has now been stopped, although the number was still at 15.1 million on November. (Google has since discontinued this “current installs” metric in favor of a new “installs on active devices" metric.)
iOS: 6.35k/day (+99.9% from the previous report)
Download numbers from App Annie
Daily downloads (with the largest countries broken out):
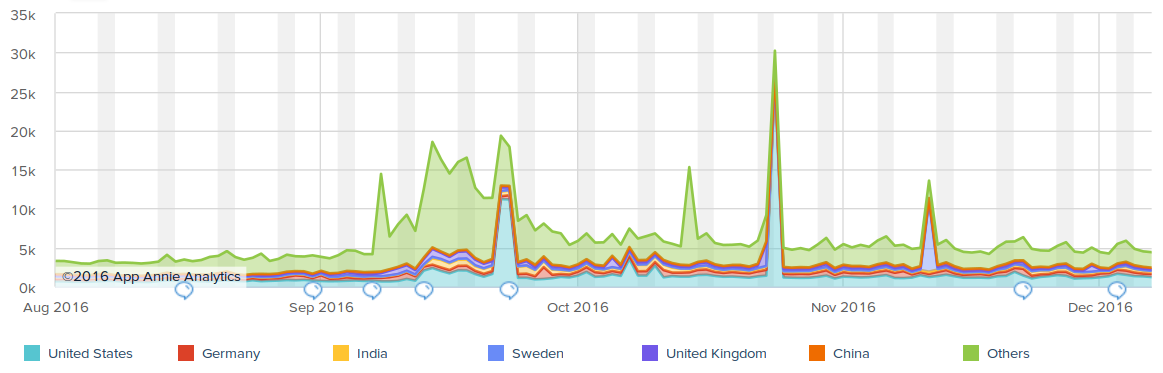
The iOS Wikipedia app was promoted on iTunes in September, with huge impact (twice as many downloads than resulted from a comparable promotion in September 2015). Total daily downloads remained on a higher level afterwards (4.8k/day during the last week of this report, Nov 28-Dec 4). Around October 24, downloads from the US spiked, possibly helped by some organic media coverage such as this. On November 11, we registered an extra 9000 downloads from Sweden, for unknown reasons (no app store promotions or media coverage that we are aware of).
App user retention
Android: 16.4% (previous report: 16.7%)
(Ratio of app installs opened again 7 days after installation, among all installed one week before a date that falls within this report. 1:100 sample)
Context (last seven months):

As remarked in earlier reports, this data is a bit too noisy for drawing conclusions about whether retention changed significantly between different releases. Retention appears to have dropped somewhat in September after having gradually grown earlier during the timespan of the last report and after.
iOS: N/A
(We recently began measuring this on the iOS app - using the same method as on Android, restricted to users who opt-in to data collection - but there is not enough data yet.)
Unique app users
Android: 1.146 million / day (+0.0% from the previous report)
Context (last six months):

In September/October, there seems to be a very small growth in daily average users.
iOS: N/A
Zareen Farooqui, Data Analyst Intern, Wikimedia Foundation
Tilman Bayer, Senior Analyst, Wikimedia Foundation
Data sources
For reference, the queries and source links used are listed below (access is needed for each). Unless otherwise noted, all content of this report is © Wikimedia Foundation and released under the CC BY-SA 3.0 license. Most of the above charts are available on Commons, too.
SELECT year, month, day, CONCAT(year,"-",LPAD(month,2,"
SELECT LEFT(timestamp, 10) AS date, sum(IF(access_method <> 'desktop', pageviews, null)) AS mobileviews, SUM(pageviews) AS allviews FROM staging.pageviews05 WHERE is_spider = FALSE AND is_automata = FALSE GROUP BY date;
Pivot URLs:
SELECT access_method, SUM(view_count)/(7*18) FROM wmf.projectview_hourly WHERE agent_type = 'user' AND CONCAT(year,"-",LPAD(month,2,"
SELECT year, month, day, CONCAT(year,"-",LPAD(month,2,"
SELECT year, month, day, CONCAT(year,"-",LPAD(month,2,"
FROM wmf.last_access_uniques_daily
WHERE year=2016 GROUP BY year, month, day ORDER BY year, month, day LIMIT 1000;
SELECT year, month, day, CONCAT(year,"-",LPAD(month,2,"
FROM wmf.last_access_uniques_daily
WHERE year=2016 GROUP BY year, month, day ORDER BY year, month, day LIMIT 1000;
SELECT year, month, day, CONCAT(year,"-",LPAD(month,2,"
SUM(IF(access_method = 'mobile web', view_count, null)) AS mobilewebviews,
SUM(IF(access_method = 'desktop', view_count, null)) AS desktopviews
FROM wmf.projectview_hourly WHERE year=2016 AND agent_type = 'user' AND project = 'en.wikipedia'
GROUP BY year, month, day ORDER BY year, month, day LIMIT 1000;
SELECT LEFT(timestamp, 8) AS date, SUM(IF(event_appInstallAgeDays = 0, 1, 0)) AS day0_active, SUM(IF(event_appInstallAgeDays = 7, 1, 0)) AS day7_active FROM log.MobileWikiAppDailyStats_
(with the retention rate calculated as day7_active divided by day0_active from seven days earlier, of course)
https://analytics.itunes.
SELECT CONCAT(year,"-",LPAD(month,2,"
https://console.developers.
https://www.appannie.com/