Link to PDF of report in Commons
Hi all,
Here is the usual look at our most important readership metrics. This time we see an overall rise in pageviews following the seasonal winter slump, examine the recent year-over-year growth in pageviews more closely, and introduce a new day-7 retention metric for the Wikipedia iOS app.
As laid out earlier, the main purpose is to raise awareness about how these are developing, call out the impact of any unusual events, and facilitate thinking about core metrics in general. As always; feedback and discussion welcome. Week-over-week and month-over-month changes are being recorded on the Product page at MediaWiki.org. This edition of the report covers a timespan of five weeks.
You can also find lots of other traffic and usage data in the quarterly metrics presentation for Q2 2016-2017 (October - December) that was just published by the WMF Reading team.
All numbers below are averages for January 2 - February 5, 2017 unless otherwise noted.
Pageviews
Total: 582 million/day (+10.14% from the previous report)
Context (April 2015-February 2017):

See also the Vital Signs dashboard
After the seasonal winter slump, we see a rise in desktop pageviews, as expected. Mobile pageviews continue to remain at higher levels than before christmas. The previously mentioned iOS app’s pageview increase is still under investigation, and may turn out to be an anomaly inflating mobile pageviews by roughly 5 million views per day.

This chart looks at long-term traffic trends from May 2013 - January 2017. This shows that over this timespan, the annual change in overall pageviews was -2%, desktop has been down 15%, and mobile (web + apps) has been trending upwards at a rate of 23% per year. However, the past few months have seen total pageviews increasing year-over-year (chart further below).
To facilitate our understanding of which traffic movements are seasonal and which may indicate lasting changes, here is a chart overlaying the total pageview numbers back to May 2013 (the earliest time for which we have data according to the current pageview definition):

Total pageviews have continued rising and are now higher than before the winter holidays. The blue line shows that the increase in overall pageviews year-over-year remains (January 2017 is up 5% from January 2016). It is possible that a smaller part of this is due to unidentified bot traffic (e.g. we just updated the pageview definition to exclude a recently discovered bot that had been causing up to 0.9% of total pageviews). But overall it is starting to look like a small but sustained rise in real human pageviews.

Here we see that the changed trend in recent months can be attributed to desktop pageviews, which have mostly stopped declining year-over-year. This chart also shows that the seasonal christmas dip in pageviews comes predominantly from desktop views. Most recently, January 2017 desktop pageviews are again down 1.8% from January 2016, but that is still much less than the aforementioned -15% yearly trend since 2013.

Year-over-year mobile pageviews are still increasing at a notable rate, but slower than in 2013-15. January 2017 mobile pageviews are up 13% from January 2016, less than the yearly mobile growth of 23% in the overall 2013-17 timespan. We can see how mobile pageviews always increase around the winter holidays and maintain higher levels afterwards.
Desktop: 50.9% (previous report: 51.5%)
Mobile web: 46.7% (previous report: 46.8%)
Apps: 2.4% (previous report: 1.7%)

Mobile percentage dropped a bit following the christmas spike, but remains high at an average of 49% mobile views. The previously mentioned iOS app’s pageview increase is still under investigation, and may turn out to be an anomaly inflating this metric by about 1%.
Global North ratio: 77.3% of total pageviews (previous report: 76.8%)
Context (January 2016-February 2017):

Although Global North pageview percentage fell following the winter spike, but overall this metric grew since the last report. Levels remain in the high 70 percentile range.
NB: We are currently rethinking this metric and might replace it with a different country selection constructed as part of the work on the New Readers project
Unique devices
See the announcement blog post from March 2016 for background and details on this metric. These estimated numbers are provided for all Wikimedia language projects (separately for the desktop and mobile web version). Because of the instrumentation method, there is no global metric for all projects and all languages, but it is currently being extended to a cross-language global metric per project at least. For now, we track the daily numbers of English Wikipedia in this report.
Daily unique devices estimate for English Wikipedia:
Mobile web: 36.3 million
Desktop: 24.3 million
Total: 60.6 million
Average mobile web ratio: 60.0%
Context (January 2016- February 2017):

Since the last report, both daily unique desktop devices and mobile devices grew. Mobile web daily uniques mirrors the daily pageviews chart - mobile web unique levels have remained higher than before the winter bump.
January 2017 was the first month we could compare year-over-year changes in unique devices. While pageviews on English Wikipedia are up from January 2016, the number of monthly unique devices is down 16%. For this report timespan (Jan 2 - Feb 5), daily mobile web uniques are up 2.6%, while daily desktop uniques are down 8.2%. This is currently being investigated.

While the number of daily unique desktop devices has grown overall, the ratio of pageviews to devices on desktop has steadily declined back to pre christmas levels. The small, but notable increase in daily views per device for mobile web which happened in November has held up.
New app installations
Android: 18.0k/day (-5.9% from the previous report)
Daily installs per device, from Google Play
Context (last nine months):

The number of daily installs dropped after the christmas spike, but remains higher than the number of uninstalls (except for January 26). Overall, the number of daily installs has dropped nearly 6% and daily uninstalls dropped about 8% since the last report.
iOS: 5.67k/day (+6.5% from the previous report)
Download numbers from App Annie
Context (last two months):
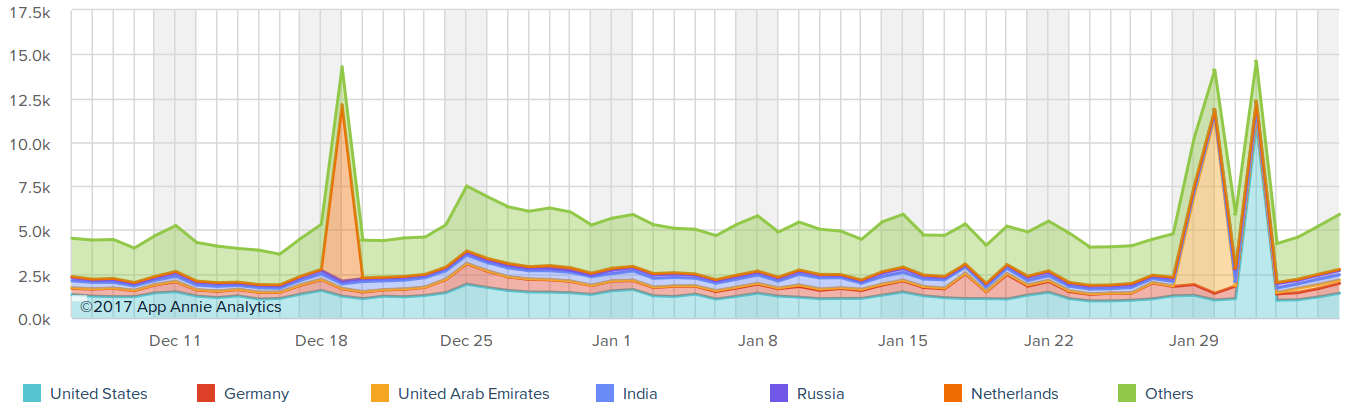
Similar to other mobile metrics measured in this report, the iOS app download metric has remained higher than usual following the winter bump. During the timespan of this report, iOS app downloads remain fairly steady besides two large, unusual spikes at the end of January in the United Arab Emirates and the United States (which follow the spike from the Netherlands in December) which are likely anomalies. We are looking into filing a bug report with App Annie to investigate this.
App user retention
Android: 15.6% (previous report: 16.8%)
(Ratio of app installs opened again 7 days after installation for all dates that fall within this report. 1:100 sample)
Context (last six months):

As remarked in earlier reports, this data is a bit too noisy for drawing conclusions about whether retention changed significantly between different releases. However, we can at least rule out the existence of major shifts during this timespan. There was a small spike in day 7 retention for installs on January 22nd.
iOS: 19.2% (previous report: N/A)
(Ratio of app installs opened again 7 days after installation for all dates that fall within this report. 100:100 sample since iOS app only sends data when users opt-in so there is a small user base)
Context (last two months):

After a long break where we refrained from reporting iOS retention here due to data quality issues with the number provided by Apple, we are happy to report iOS app 7 day retention again, based on a new EventLogging instrumentation that parallels the one on Android. There doesn’t seem to have been any significant changes in retention levels during the timespan of this report, even after new releases of the app. Looking back at December though, it appears that there was a period of lower retention which roughly corresponds with stability issues (crashes) the app was having at this time, and which have since been fixed.
Unique app users
Android: 1.211 million / day (+2.7% from the previous report)
Context (last eight months):

Android daily average levels have remained higher following the christmas and new year’s bump. This matches the mobile pageviews and unique mobile devices metrics.
iOS: N/A
Zareen Farooqui, Data Analyst Intern, Wikimedia Foundation
Tilman Bayer, Senior Analyst, Wikimedia Foundation
Data sources
For reference, the queries and source links used are listed below (access is needed for each). Unless otherwise noted, all content of this report is © Wikimedia Foundation and released under the CC BY-SA 3.0 license. Most of the above charts are available on Commons, too.
SELECT year, month, CONCAT(year,"-",LPAD(month,2,"0")) as yearmonth, SUM(view_count) AS allhuman, sum(IF(access_method = 'desktop', view_count, null)) AS desktophuman FROM wmf.projectview_hourly WHERE year = 2017 AND agent_type = 'user' GROUP BY year, month ORDER BY year, month LIMIT 1000;
SELECT year, month, day, CONCAT(year,"-",LPAD(month,2,"0"),"-",LPAD(day,2,"0")) as date, sum(IF(access_method <> 'desktop', view_count, null)) AS mobileviews, SUM(view_count) AS allviews FROM wmf.projectview_hourly WHERE year = 2017 AND agent_type = 'user' GROUP BY year, month, day ORDER BY year, month, day LIMIT 1000;
SELECT access_method, SUM(view_count)/(7*5) FROM wmf.projectview_hourly WHERE agent_type = 'user' AND CONCAT(year,"-",LPAD(month,2,"0"),"-",LPAD(day,2,"0")) BETWEEN "2017-01-02" AND "2017-02-05" GROUP BY access_method;
SELECT year, month, day, CONCAT(year,"-",LPAD(month,2,"0"),"-",LPAD(day,2,"0")), SUM(view_count) AS all, SUM(IF (FIND_IN_SET(country_code, 'AD,AL,AT,AX,BA,BE,BG,CH,CY,CZ,DE,DK,EE,ES,FI,FO,FR,FX,GB,GG,GI,GL,GR,HR,HU,IE,IL,IM,I S,IT,JE,LI,LU,LV,MC,MD,ME,MK,MT,NL,NO,PL,PT,RO,RS,RU,SE,SI,SJ,SK,SM,TR,VA,AU,CA,HK,MO, NZ,JP,SG,KR,TW,US') > 0, view_count, 0)) AS Global_North_views FROM wmf.projectview_hourly WHERE year = 2017 AND agent_type='user' GROUP BY year, month, day ORDER BY year, month, day LIMIT 1000;
SELECT year, month, day, CONCAT(year,"-",LPAD(month,2,"0"),"-",LPAD(day,2,"0")) as date, SUM(IF(uri_host LIKE 'en.m.wikipedia%', uniques_estimate, 0)) AS enwiki_mobile_web FROM wmf.last_access_uniques_daily WHERE year=2017 GROUP BY year, month, day ORDER BY year, month, day LIMIT 1000;
SELECT year, month, day, CONCAT(year,"-",LPAD(month,2,"0"),"-",LPAD(day,2,"0")) as date, SUM(IF(uri_host LIKE 'en.wikipedia%', uniques_estimate, 0)) AS enwiki_desktop FROM wmf.last_access_uniques_daily WHERE year=2017 GROUP BY year, month, day ORDER BY year, month, day LIMIT 1000;
SELECT year, month, day, CONCAT(year,"-",LPAD(month,2,"0"),"-",LPAD(day,2,"0")) AS date, SUM(IF(access_method = 'mobile web', view_count, null)) AS mobilewebviews, SUM(IF(access_method = 'desktop', view_count, null)) AS desktopviews FROM wmf.projectview_hourly WHERE year=2017 AND agent_type = 'user' AND project = 'en.wikipedia' GROUP BY year, month, day ORDER BY year, month, day LIMIT 1000;
https://www.appannie.com/dashboard/252257/item/324715238/downloads/
SELECT LEFT(timestamp, 8) AS date, SUM(IF(event_appInstallAgeDays = 0, 1, 0)) AS day0_active, SUM(IF(event_appInstallAgeDays = 7, 1, 0)) AS day7_active FROM log.MobileWikiAppDailyStats_12637385 WHERE timestamp LIKE '2017%' AND userAgent LIKE '%-r-%' AND userAgent NOT LIKE '%Googlebot%' GROUP BY date ORDER BY DATE;
SELECT LEFT(timestamp, 8) AS date, SUM(IF(event_appInstallAgeDays = 0, 1, 0)) AS day0_active, SUM(IF(event_appInstallAgeDays = 7, 1, 0)) AS day7_active FROM log.MobileWikiAppDailyStats_12637385 WHERE userAgent LIKE '%iPhone%' OR userAgent LIKE '%iOS%' GROUP BY date ORDER BY DATE;
SELECT CONCAT(year,"-",LPAD(month,2,"0"),"-",LPAD(day,2,"0")) as date, unique_count AS Android_DAU FROM wmf.mobile_apps_uniques_daily WHERE year = 2017 AND platform = 'Android';